File Photo
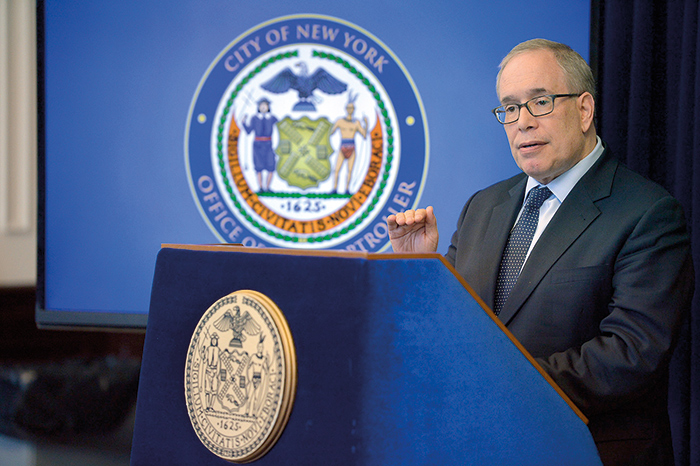
City Comptroller Scott Stringer
By Forum Staff
City Comptroller Scott Stringer on Monday released the Popular Annual Financial Report for Fiscal Year 2020, a complementary guide to the Comprehensive Annual Financial Report released last month. The PAFR distills important information about local government and its finances for use by City residents from the CAFR, using dozens of explanatory graphs, charts, and images to provide New Yorkers with an easy-to-understand 30-page roadmap to City government.
“Transparency and accountability are the foundation of good governance. The PAFR is an important document that makes the City budget accessible to all New Yorkers to understand how our city works and the facts and figures that guide everyday policymaking,” Stringer said. “This year’s PAFR, amid a global pandemic and unprecedented economic crisis, offers a straightforward look into how taxpayer dollars are generated and spent in all corners of municipal government to keep the city running and provide essential services. I continue to take pride in our office’s work in delivering this critical information to the public.”
This is the sixth year the Comptroller’s office has released the PAFR report. This Fiscal Year 2020 report will be submitted for consideration for the Government Finance Officers Association’s Award for Outstanding Achievement in Popular Annual Financial Reporting, which recognizes conformance with the highest standards for preparation of state and local government popular reports. The City of New York has received this national award for the last five consecutive fiscal years.
The majority of the data in the PAFR comes from the Comptroller’s Comprehensive Annual Financial Report, which is released every year on Oct. 31. This year’s PAFR highlights:
New York City Economy Upended
by COVID-19 Pandemic
The City’s economy broke records for the first eight months of Fiscal Year 2020, with more jobs (4.1 million in the private sector), and lower unemployment (3.4 percent in February), than ever previously recorded.
Amid the COVID-19 pandemic, between February and April, the City also broke records as the economy shed nearly 900,000 private jobs. By June, more than 1.4 million New Yorkers had filed for unemployment benefits, and the unemployment rate had risen to 20.3 percent.
Photo Courtesy of Comptroller Stringer’s Office
The majority of the data in the PAFR comes from the Comptroller’s Comprehensive Annual Financial Report.
Job losses were most acute in the generally low-wage service sectors, where remote work was not feasible and where the lack of visitors and commuters was felt most acutely.
Hotels, retail stores, bars and restaurants, arts and entertainment venues, were all shuttered from March through most of the summer. June jobs in those sectors were still down almost 41 percent from February.
In contrast, jobs in generally higher-paid office-worker sectors such as financial activities, information, and professional, scientific and technical services were down just seven percent.
Unemployment rates in communities of color skyrocketed during this period, with roughly one in four Black, Hispanic, and Asian workers out of work.
White unemployment rose from two percent before the pandemic to 14 percent in June, an increase of 12 percent. In comparison, Asian unemployment increased from roughly three percent in February to nearly 26 percent in May, implying nearly 23 percent of Asian workers lost their jobs between February and May. Similarly, Hispanic unemployment increased from five percent in February to 25 percent in May, implying over 20 percent of Hispanic workers lost their jobs between February and May.
COVID Spending
In response to the pandemic, the City incurred approximately $2.6 billion in expenditures in Fiscal Year 2020.
City Expenses
City expenses, including all related personnel and applicable pension and benefit costs, were more than $99.9 billion in FY 2020, a decrease of roughly $0.6 billion from the previous year.
City Revenue
Overall, the City brought in about $95.8 billion in revenues in FY 2020, which comes from two major sources: program revenues, such as State and Federal grants, and general revenues, like taxes.
In FY 2020, program revenue accounted for over $32.2 billion, an increase of $1.8 billion from the previous year. Program revenue primarily comes from grants received for education programs in the form of State and Federal aid ($13.4 billion), followed by general government ($5.9 billion).
In FY 2020, general revenues were over $63.6 billion, an increase of almost $0.4 billion from the previous year. Real estate taxes were the greatest single source for the increase, totaling over $29.6 billion, largely due to growth in billable Assessed Value during the fiscal year.
Roadmap to the City Budget
The PAFR includes an explanation of the City budget process as well as an explanation of the difference between the City’s “General Fund” – the main operating fund of the City – and other types of financial resources such as Capital and Debt.
The PAFR also includes information on “Component units” such as the Health and Hospitals Corporation (H+H), Water and Sewer Authority, and the NYC Housing Authority (NYCHA) – legally separate organizations for which the City is financially accountable. This information is presented separately from the financial data of the City’s “primary government.”
City Capital Project Commitments
New York City funds its capital projects using the Capital Budget, which is separate from the General Fund. The Capital Budget is exclusively used to fund capital projects and includes spending on City construction, purchases of land, buildings, and equipment. It is generally financed by the sale of government bonds.
Capital Authorized Expenditures were sufficient to address the capital needs of The City for both current and future projects.
Peer-City Comparisons
In 2019 – the most recent comparison available – New York City had 66.6 million tourists, outpacing Chicago, which had 60.8 million, and Philadelphia, which welcomed 46 million.
Each City provides different types and levels of service for its residents. In FY 2020, New York City spent over $12,748 per resident, while Chicago spent $3,054 and Philadelphia spent about $4,551.
This year, New York City’s bond rating remained the same by the ratings agency Moody’s at Aa1 rating. New York City also has an AA rating from both Standard & Poor’s and Fitch.