By Forum Staff
City Department of Finance Commissioner Preston Niblack on Wednesday announced the publication of the tentative property tax assessment roll for Fiscal Year 2026.
The tentative assessment roll for FY 2026 shows the total market value of all City properties is $1.579 trillion, a 5.7-percent increase from FY 2025. Citywide taxable billable assessed value, the portion of market value to which tax rates are applied, increased by 3.9 percent to $311.2 billion.
Market values for FY 2026 reflect real estate activity from Jan. 6, 2024 to Jan. 5, 2025, the taxable status date, as well as income and expense information for commercial properties during calendar year 2023 and submitted to DOF in 2024.
The tentative roll shows citywide construction activity added $12.1 billion in new market value. Manhattan, Brooklyn and Queens accounted for 88 percent of overall construction activity in the city, with Brooklyn registering the highest percent increase in construction activity among the boroughs at 1 percent.
Highlights by tax classes:
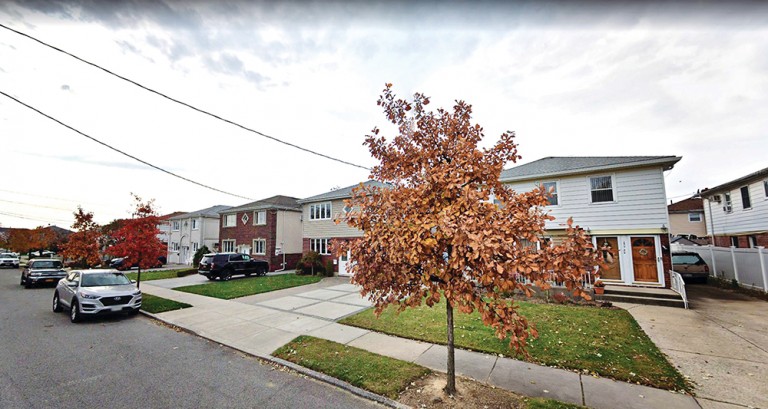
Class 1 (1-3 family homes)
- Total market value increased by 5.8 percent to $781.7 billion, driven primarily by market forces. Assessed values rose by 5.5 percent to $27.2 billion.
- Class 1 homes in Staten Island had the greatest percent increase in market value, at 7.8 percent, while Queens had the greatest percent increase in assessed value, up 6 percent; Staten Island and Brooklyn followed closely at 5.6 percent and 5.1 percent, respectively.
Class 2 (cooperatives, condominiums and rental apartment buildings)
- Total market value increased by 7.3 percent to $396.6 billion, a $27.1 billion difference from Fiscal Year 2025.
- The total assessed value increased by 4.8 percent, to $120.7 billion. Brooklyn experienced the largest market value percent increase for Class 2, at 9.4 percent, and had the largest taxable billable assessed value percent increase at 10.7 percent.
- Class 2 rentals saw a market value increase of 9.9 percent. Class 2 cooperatives saw a market value increase of 4.6 percent, while condominiums saw a market value increase of 5.1 percent.
- The total assessed value increased by 6.4 percent for Class 2 rental apartments. Brooklyn had the largest market value increase at 15.3 percent and the largest taxable billable assessed value increase at 16 percent for rental apartments.
Class 3 (utilities and special franchise properties)
- The market value for Class 3 properties, which includes property with equipment owned by a gas, telephone, or electric company, is tentatively set by the State Office of Real Property Tax Services at $61.1 billion.
Class 4 (commercial properties)
- Citywide total market value increased by 3.8 percent to $339.5 billion driven primarily by market forces. Brooklyn had the largest percent increase in market value at 6.3 percent.
- Total assessed values increased by 2.9 percent, to $135.9 billion. Commercial properties in Brooklyn saw the largest increase in assessed value, at 7.1 percent.
- Office buildings experienced an increase of 2.7 percent in market value. Retail buildings and hotels registered a market value increase of 2.5 percent and 5.9 percent, respectively.
- Total assessed value for office buildings increased by 2 percent. Citywide retail buildings saw a 1.1 percent increase in taxable billable assessed value. Brooklyn had the largest increase in assessed value at 3.2 percent for retail buildings. Citywide assessed value for hotel buildings increased by 0.2 percent.
The tentative roll is available at nyc.gov/site/finance/property/property-assessments.page. Owners can file a challenge to their property’s assessment by visiting the City Tax Commission website at nyc.gov/site/taxcommission/forms/general-instructions.page.

