Courtesy of the Bus Turnaround Coalition
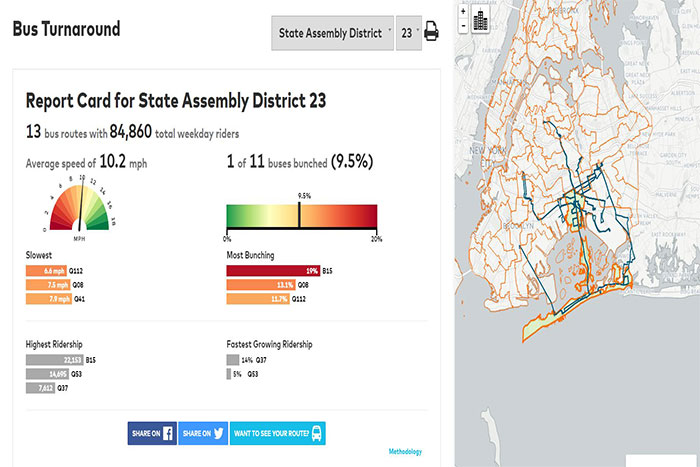
See a high-level report card on any bus route across the five boroughs at busturnaround.nyc/district.
By Michael V. Cusenza
Commuters across the five boroughs this past week may have heard or read mentions of the Bus Turnaround Coalition. The transit advocacy “supergroup,” composed of the Straphangers Campaign, the Riders Alliance, the TransitCenter transportation reform foundation, and the Tri-State Transportation Campaign, helped craft and release a letter to Gov. Andrew Cuomo last Thursday calling on him to step in and repair the ailing Metropolitan Transportation Authority bus division.
The missive, which boasted the signatures of 67 members of the State Senate and Assembly, including many elected officials representing Queens communities, urged Cuomo to direct the MTA to commit to two low-cost solutions to improve bus service: In order to help speed up buses and reduce bus bunching, the agency should deploy a robust transit signal priority network by 2018; and ensure that all-door boarding is a prominent part of the agency’s plans for implementation of the MetroCard replacement payment system.
However, what commuters may not be aware of is one of the main reasons that the letter was organized and sent. In April, the Coalition released an interactive online Assembly district-level bus report card tool, which allows riders and elected officials to see the quality of service in their neighborhoods. The report cards also feature detailed and easy-to-understand information about bus speeds, reliability and ridership in their communities.
While the BTC noted that bus speeds and reliability vary from district to district, citywide, buses average 7.4 miles per hour. The impacts of service declines are apparent in ridership data, according to the Coalition: From 2002 to 2015, bus ridership fell 16 percent, despite citywide population growth and record subway ridership.
According to the BTC report card for the 23rd Assembly District, which includes Rockaway, Broad Channel, Hamilton Beach, Lindenwood, Howard Beach, and Ozone Park, there are 13 bus routes with approximately 84,860 total weekday riders. The average speed of D23 buses is 10.2 mph, and one of every 11 buses bunched – a rate of 9.5 percent. And the Q52/53 is among the lines with the highest ridership in the district – 14,695. And, at 5 percent, the 52/53 also has the second-fastest growing ridership in the 23rd District.
Additionally, last summer, the Coalition released its report, “Turnaround: Fixing New York City’s Buses.” The report highlights cities like London and Seoul that have managed to transform their bus networks, leading to increased ridership system-wide, and identifies steps to fix NYC’s bus network:
• More frequent service on routes with high ridership or high ridership potential
• Redesign of routes with obsolete or indirect routing
• Use the post-MetroCard fare payment system to allow all-door bus boarding
• Overhaul bus dispatching and on-street control
• Create more bus lanes and widespread traffic signal priority for buses
• Report bus performance in ways riders can easily understand and institute a comprehensive open data policy
“Public transportation, especially bus service, provides millions of New Yorkers alternate ways to get around the city. It is essential that the MTA continue to improve their service,” said Assemblyman Michael DenDekker (D-East Elmhurst). “Transit signal priority and all-door boarding technology are great technological improvements that have the potential to enhance riders travel time, making travel more fluid.”